Ontology Graph
The Ontology Graph is the semantic core of the Company Brain. It links structured data and documents to the business concepts your teams use, so plain-English questions can land on the right data.
The Ontology Graph is what makes the Company Brain more than a search index. When you connect a data source, Parcle does not just index raw content. It builds a living semantic map that links your company's structured data and documents to the business concepts your teams talk about every day: "revenue," "GMV," "churn," "active account," or any term that matters to you.
The graph is company-wide and evolves over time. The more your agents use it, the better it understands your data.
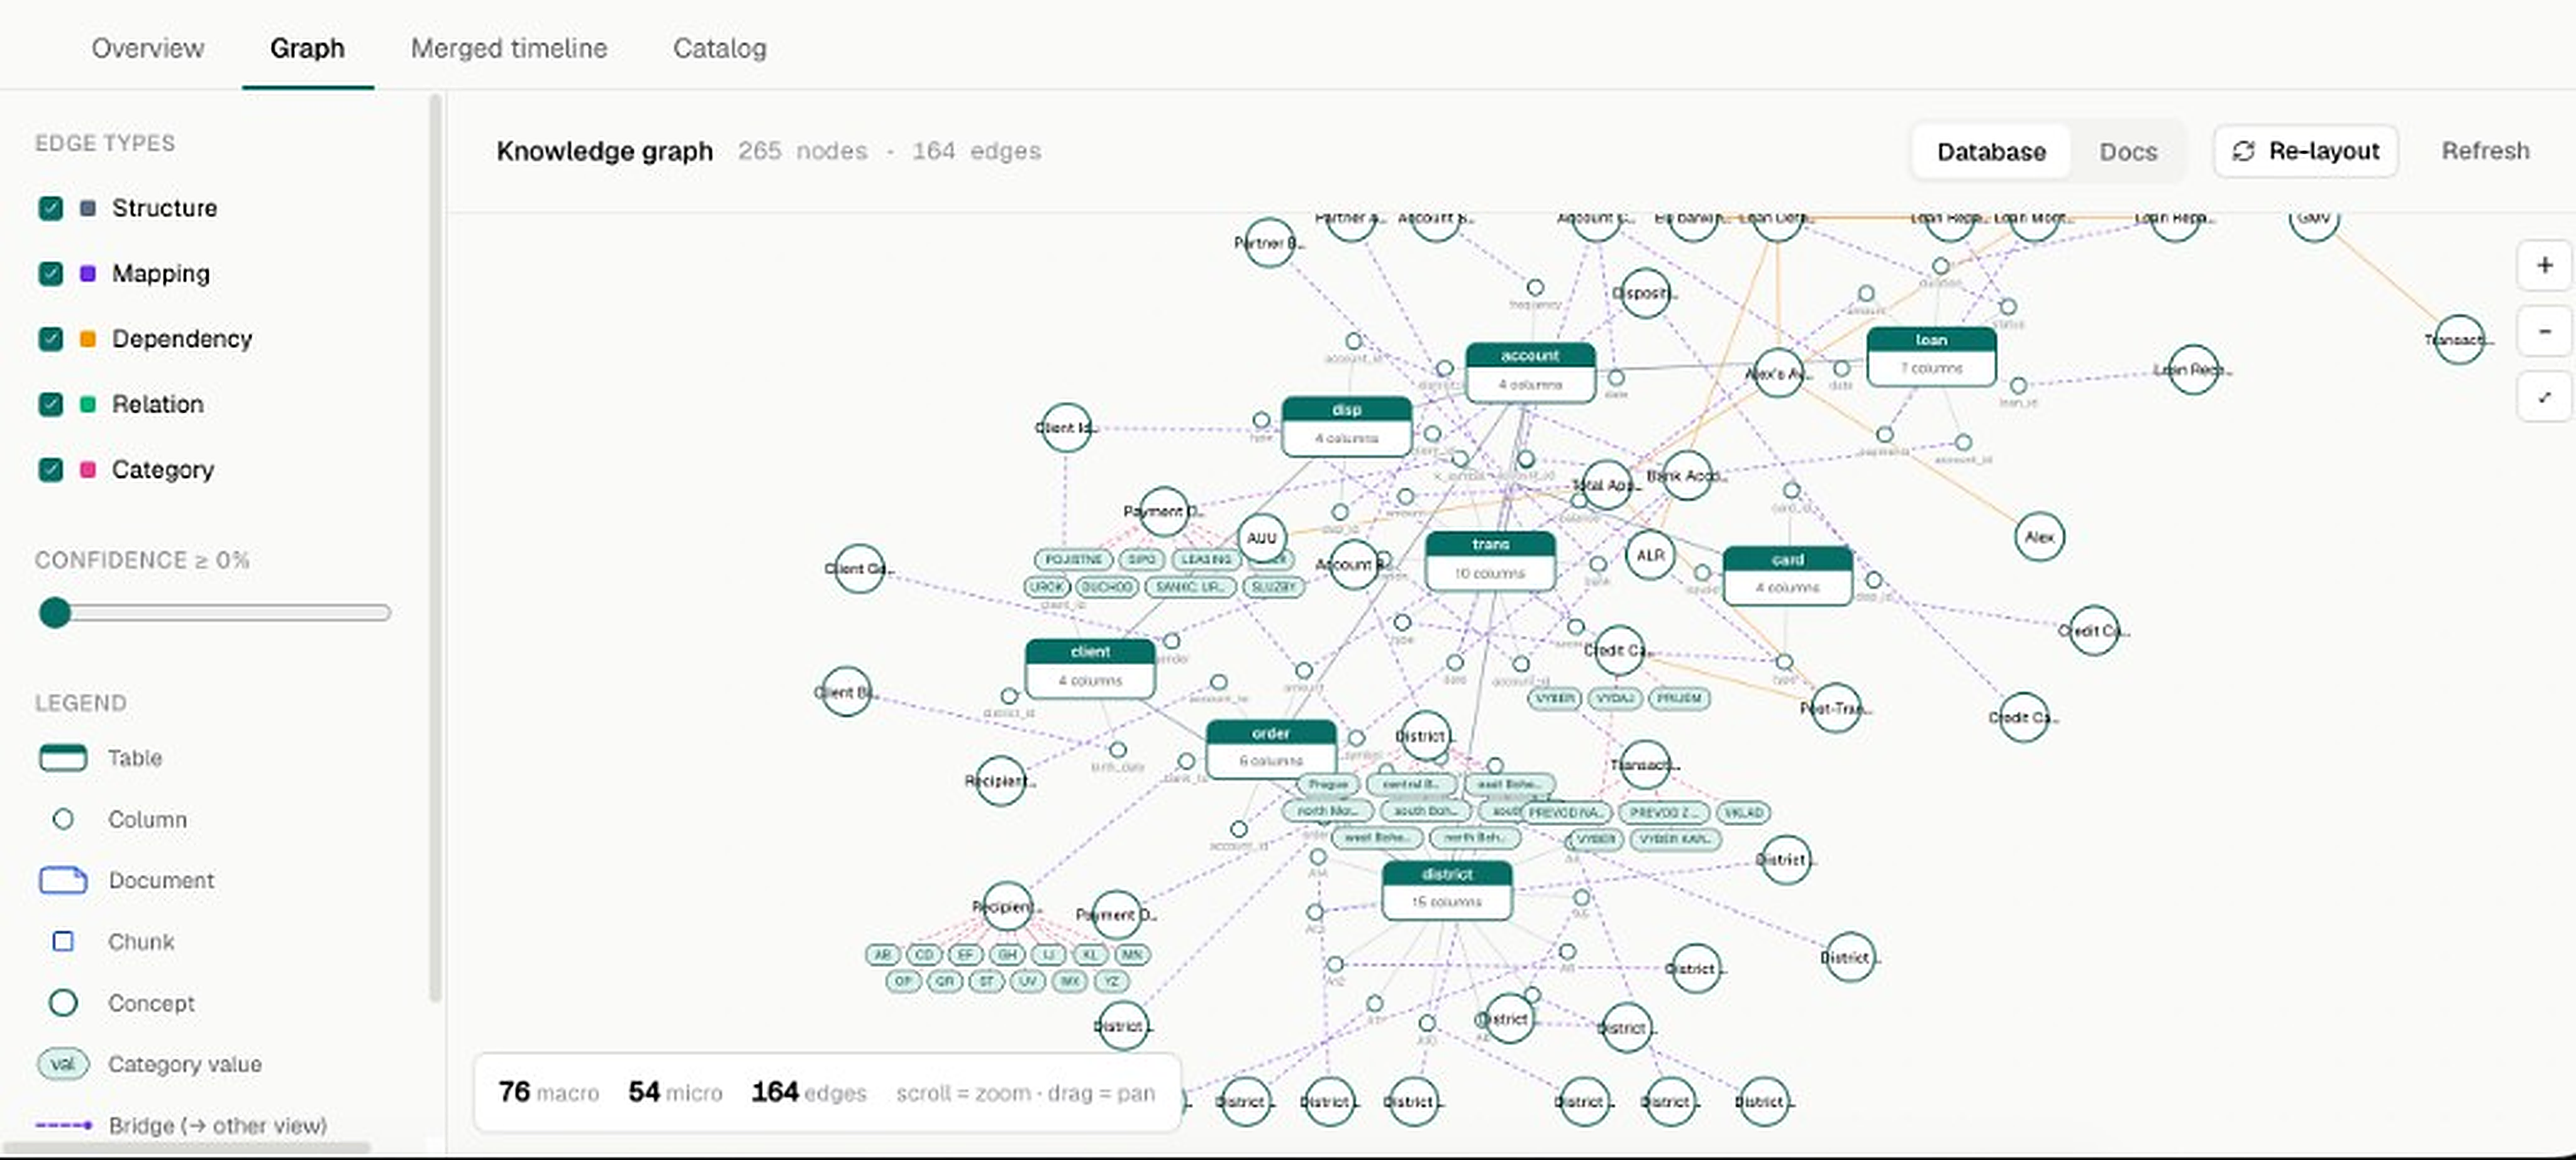
Two kinds of nodes#
Things that exist directly in your data sources: your structured data, documents, and their contents. Factual nodes are authoritative: they reflect exactly what is in your data and update when your data changes.
Business concepts and terminology, such as "revenue," "GMV," "return rate," and "East region." Concept nodes capture your company's semantic layer: definitions, synonyms, formulas, and relationships between ideas.
The graph connects these two worlds through concept-to-data links, connections that say, for example, "the concept 'revenue' corresponds to a specific measure in a connected data source." This bridge is what lets the Company Brain translate a plain-English question into a precise answer grounded in your data.
How the graph is built#
Parcle reads your connected sources directly: their structure, their relationships, and the shape of the values they hold. This produces an accurate factual foundation straight from the source.
Parcle then reasons about what your data means and how it connects, distilling raw structure into the business concepts your teams actually use and mapping the relationships between them. The result is a shared semantic understanding of your company's knowledge, not just an index of it.
Every question and correction updates the graph's understanding. When an agent asks a question or someone corrects an answer, that learning is used in future answers.
Steering the graph#
The graph is not a black box. Your teams can review it and refine it: correct a definition, add a synonym, or adjust a relationship. Changes take effect immediately and improve every subsequent answer, and refinements are reversible, so you can adjust the meaning of your data without ever risking the underlying facts.
This is how knowledge encoded once benefits every agent: define "revenue excludes refunds" a single time, and every agent's answers reflect it from then on.
Keep a fleet of agents in sync with the brain and with each other.